8.8 EMP_sankey_plot
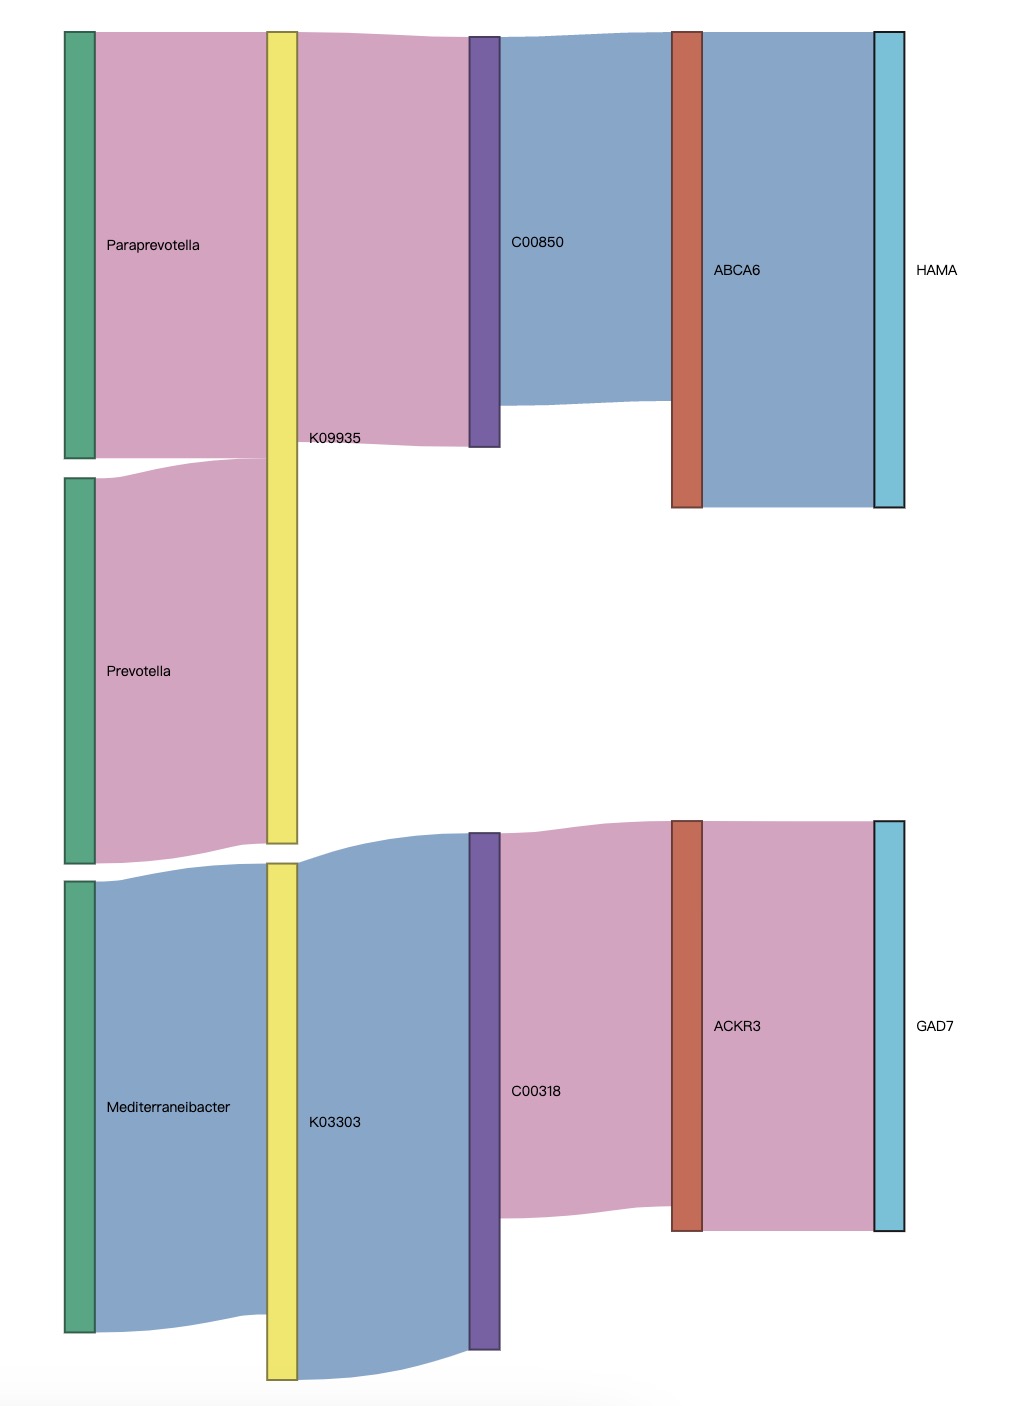
Sankey diagram is a specific type of flow diagram that is often used to describe the interrelationships between multiple sets of features. The module EMP_sankey_plot can draw a correlation Sankey diagram based on the multiple correlation results calculated by the module EMP_cor_analysis.
Note:
①In the plot, red represents positive relationship, while blue represents negative relationship.
②The correlation Sankey diagram assesses the relationships between each node, filtering out isolated nodes.
③Parameter
①In the plot, red represents positive relationship, while blue represents negative relationship.
②The correlation Sankey diagram assesses the relationships between each node, filtering out isolated nodes.
③Parameter
pvalue and rvalue can set the filter threshold.
🏷️Example:
micro_data <- MAE |>
  EMP_assay_extract('taxonomy') |>
  EMP_identify_assay(method='default') |>
  EMP_collapse(estimate_group = 'Genus',collapse_by = 'row') |>
  EMP_decostand(method='relative')

ko_data <- MAE |>
  EMP_assay_extract('geno_ko') |>
  EMP_identify_assay(method='edgeR') |>
  EMP_diff_analysis(method='DESeq2',.formula = ~Region+Group) |>
  EMP_filter(feature_condition = pvalue < 0.05)

metabolite_data <- MAE |>
  EMP_assay_extract(experiment = 'untarget_metabol') |>
  EMP_collapse(estimate_group = 'MS2kegg',collapse_by='row',
               na_string = c("NA", "null", "","-"),
               method = 'mean',collapse_sep = '+') |>
  EMP_decostand(method = 'relative') |>
  EMP_dimension_analysis(method = 'pls',estimate_group = 'Group') |>
  EMP_filter(feature_condition = VIP >2)

host_gene <- MAE |>
  EMP_assay_extract('host_gene') |>
  EMP_identify_assay(method='edgeR') |>
  EMP_diff_analysis(method='DESeq2',.formula = ~Region+Group) |>
  EMP_filter(feature_condition = pvalue < 0.05)

meta_data<- MAE |>
  EMP_assay_extract('taxonomy') |>
  EMP_coldata_extract(action = 'add',
                      coldata_to_assay = c('SAS','SDS','HAMA','HAMD','PHQ9','GAD7'))

(micro_data + ko_data + metabolite_data + host_gene + meta_data) |>
  EMP_cor_analysis() |>
  EMP_sankey_plot()